Monitoring is a crucial part of running any kind of application. Making sure that you have up-to-date information about the system where your application is set up is very important. For this purpose, there are a couple of monitoring tools which you can use. I think one of the well-known tool is Prometheus with Grafana. It’s a very nice tool, has a ton of customization but it might be a bit heavyweight for just starting the monitoring journey.
Now I’m going to show you how to set up a different tool, Netdata for monitoring the system as well as setting up Slack integration to get notified when something goes wrong. Netdata can show you CPU usage, memory usage, I/O data, network information and so much more. It’s also very pluggable with other applications, meaning that it will basically monitor everything on the system which is installed. For example, if you have MySQL installed, Netdata will provide you monitoring data on the dashboard for MySQL. More details on Netdata can be found here.
Setting up Netdata
In the tutorial, I’ll use Ubuntu 16.04 LTS as a system to be monitored and it will be running on a VirtualBox virtual machine, but you can use any other Linux distribution if you want.
Netdata is a great tool and it’s really easy to install. It has a great documentation with the installation steps. For Ubuntu 16.04, I can simply install Netdata with the following command:
bash <(curl -Ss https://my-netdata.io/kickstart.sh)
This will walk you through the installation process. There are other ways to install Netdata as well, refer to the Installation guide for it.
After finishing the installation, you should have access to the Netdata dashboard. Go to your browser and type in the IP of the machine with port 19999 by default. In my case this was http://192.168.1.12:19999
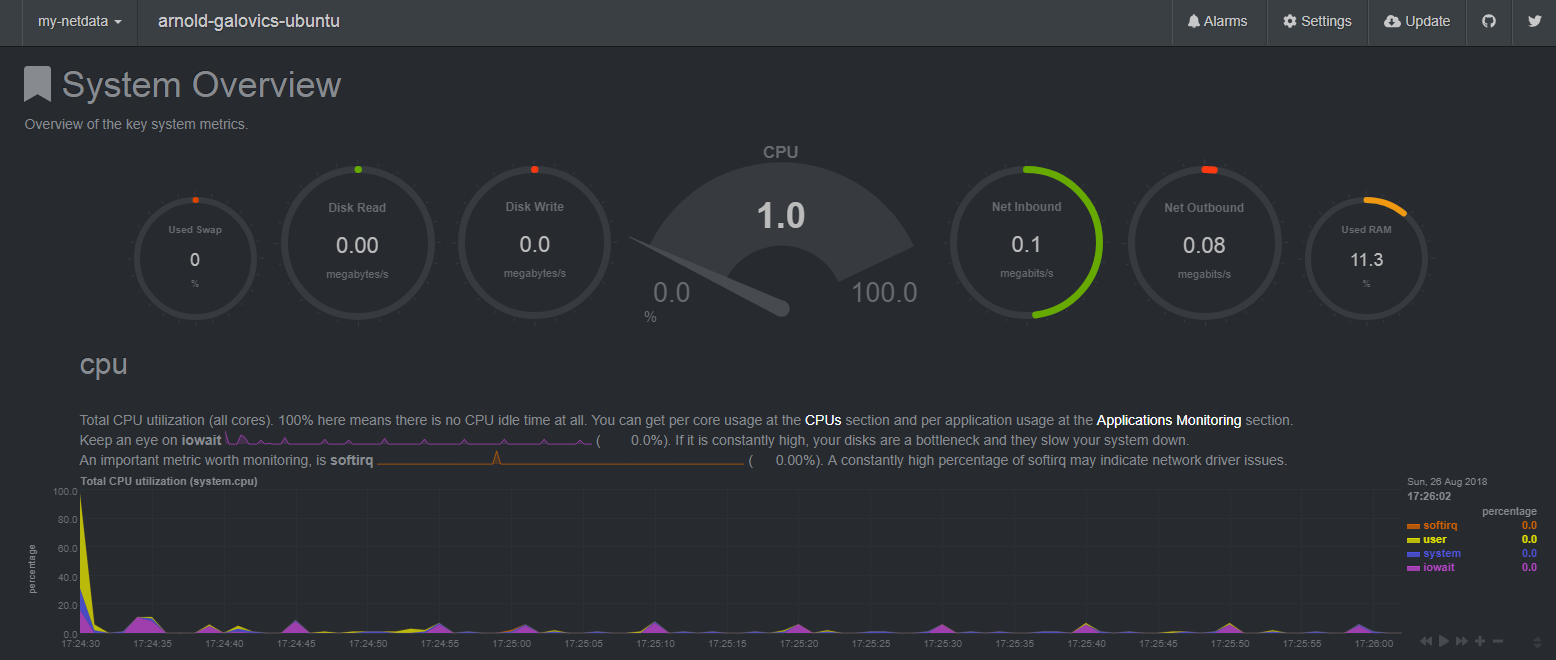
That’s it. It was this easy to install Netdata to the machine. Of course, it’s running with all the default configurations which is fine for a starting point and overall it took 5 minutes to do the installation.
Netdata has an alerting feature as well. If the disk space goes low, the CPU is running on 85% for 10 minutes, etc. Netdata will show an alarm on the dashboard.
There are a couple of alerts configured within Netdata by default. You can check these in the Alarms menu on the top of the dashboard.
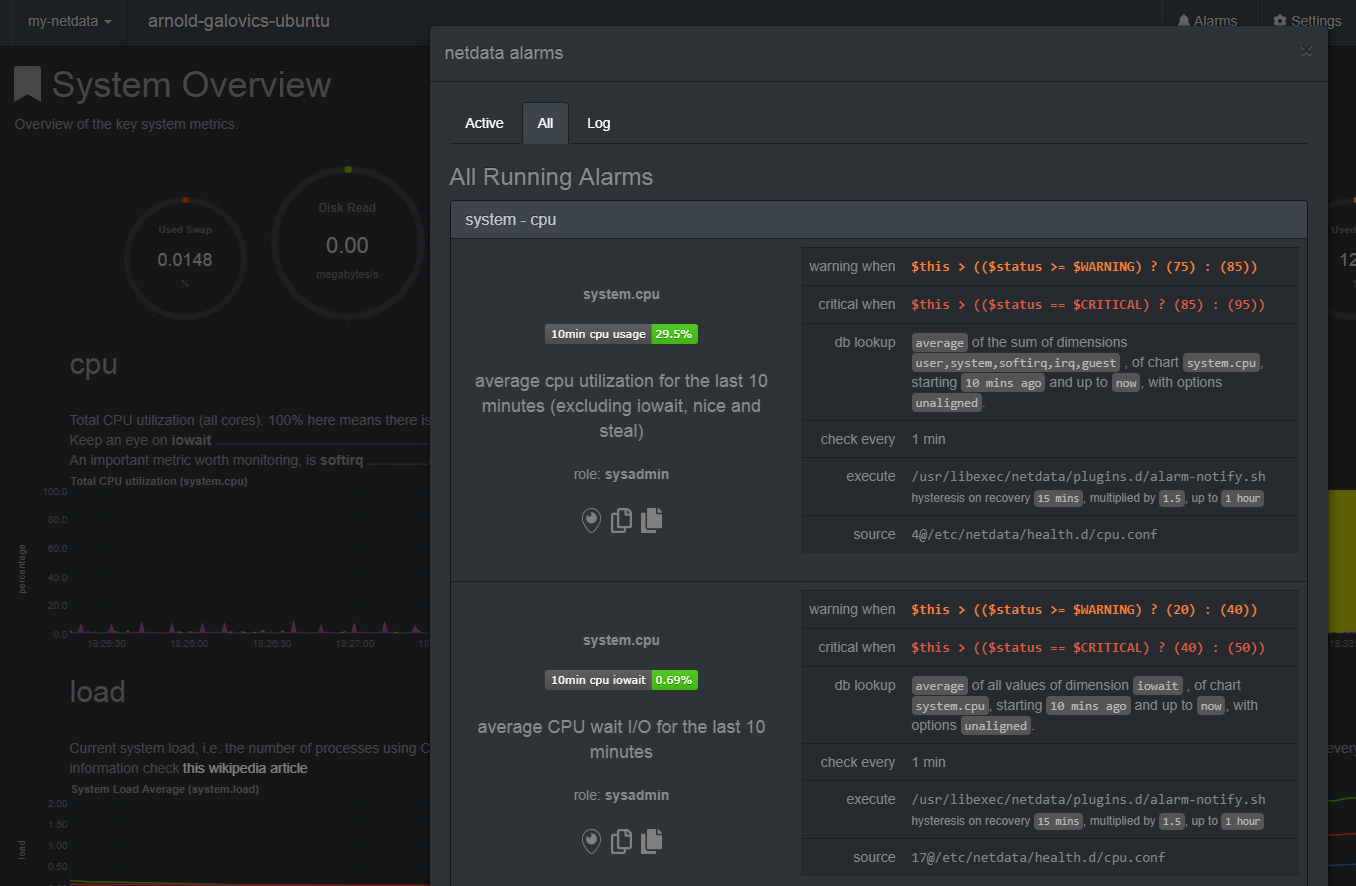
It can send emails, send SMS to your phone and there are other ways of notifications as well. Slack is getting widely used by projects for internal communication and the great thing is that Netdata integrates with Slack out of the box.
Setting up Slack for notifications
If you already have an existing Slack workspace which you want Netdata to send the notifications to, use that, otherwise create a Slack workspace here.
Let’s create a new channel in your workspace for the alerts because obviously you don’t want to get spammed all the time on other channels where important discussion is going on.
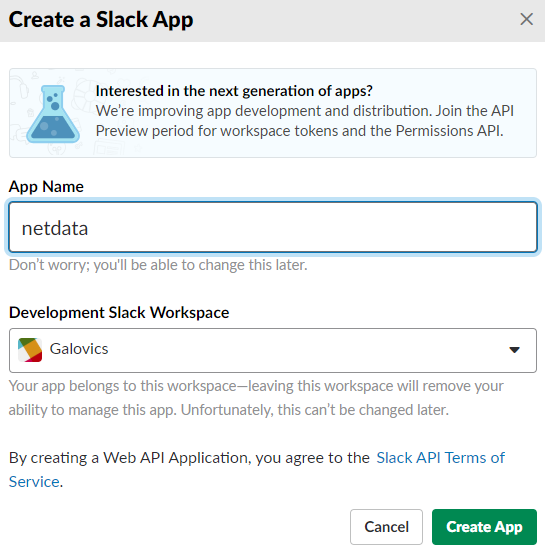
For connecting Netdata to your Slack channel, you must create a webhook interface which can be used by Netdata to send the actual messages. This is done by creating a new app for the workspace here. Just type in some app name and the workspace you wanna use it for.
Now click on Incoming Webhooks and activate it on the top right corner. At the bottom of this page there will be an Add New Webhook to Workspace button which will create the actual webhook URL. Clicking this will prompt you to use this app in a specific channel. I’ll use the newly created #alarms for it. Click on Authorize and that’s it, you have the webhook set up.
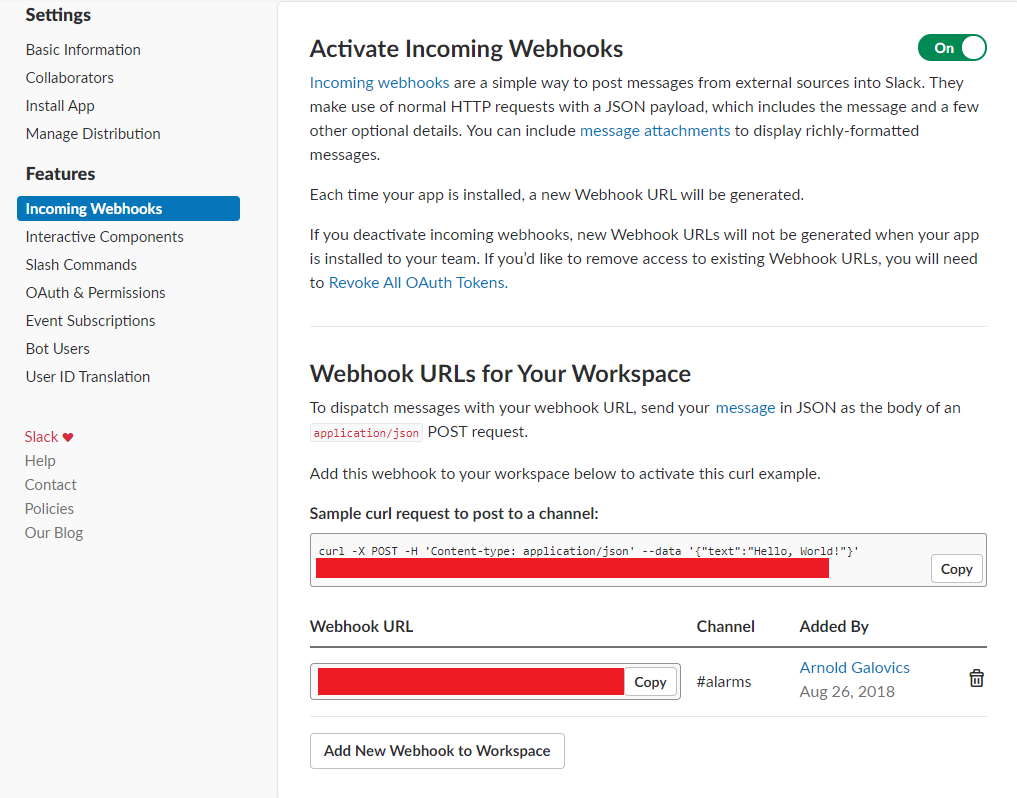
Copy this webhook URL as it will be used for the Netdata configuration. Go back to your terminal and edit the health_alarm_notify.conf file. I’ll use vim for this but use whatever you like.
sudo vim / etc/netdata/health_alarm_notify.conf # note the spaces before etc
There are 3 properties which needs to be set:
- SEND_SLACK=”YES”
- SLACK_WEBHOOK_URL=”<WEBHOOK_URL>”
- DEFAULT_RECIPIENT_SLACK=”alarms”
Save the file and restart Netdata (note that for the current version of Netdata, it’s not required to restart the service, the configuration change will be automatically picked up)
sudo service netdata restart
Log in as netdata user with the following command and test the notification integration.
sudo su -s /bin/bash netdata
Execute the following command to send a test alarm.
/usr/libexec/netdata/plugins.d/alarm-notify.sh test
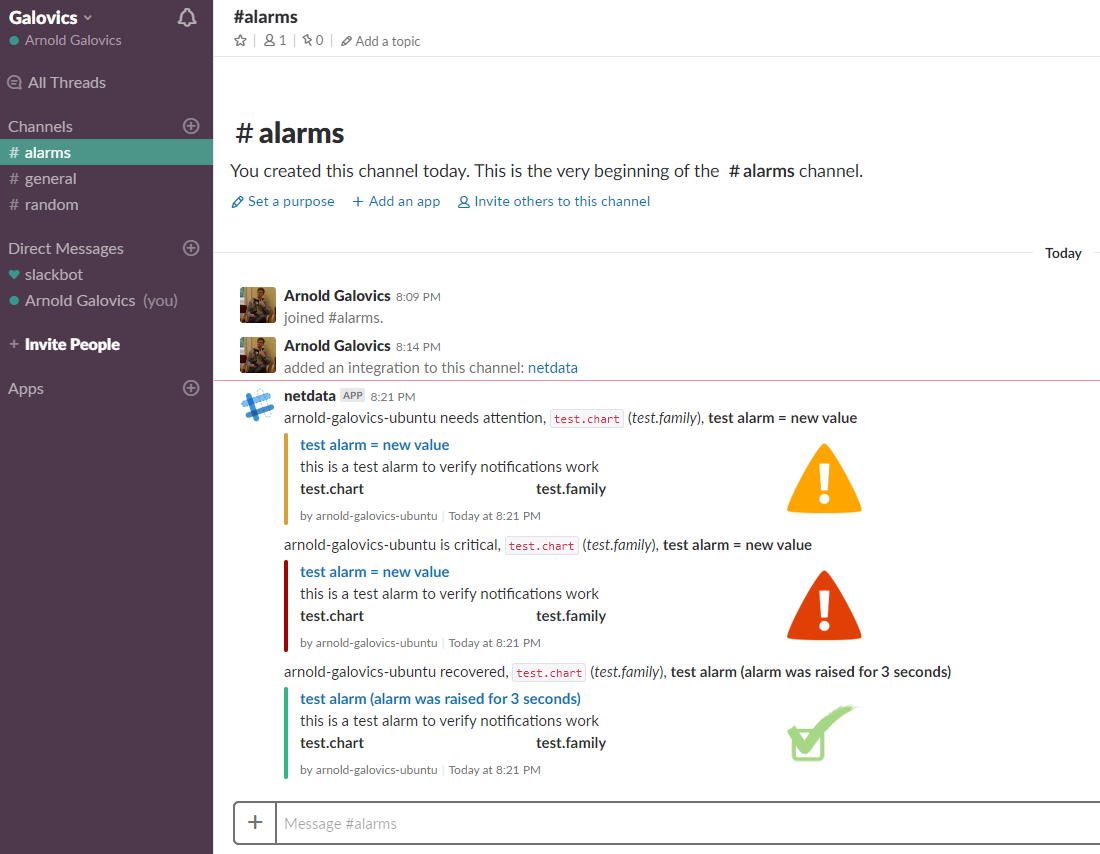
This is what the output should look like in the terminal and in Slack.

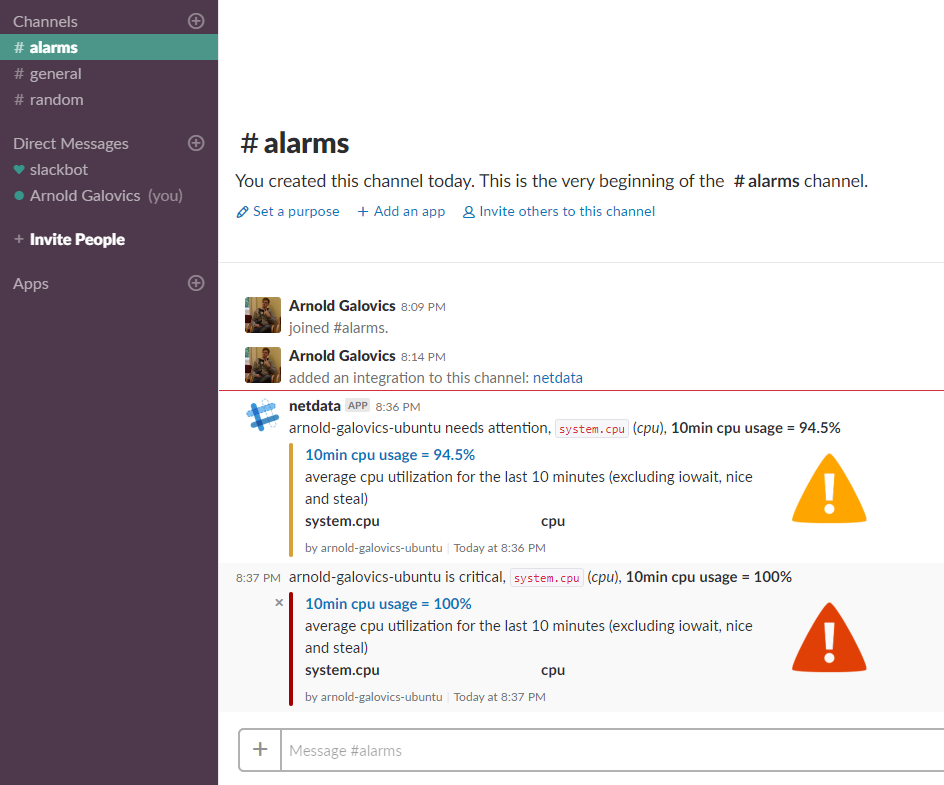
And here’s how a real alarm (CPU load 85%+) would look like in Slack.
Summary
We’ve seen how Netdata can be installed and configured for Slack alarm notifications which is very useful to monitor your system and see when something bad is going on. It also has a great dashboard with tons of data and don’t forget that it automatically picks up the installed applications on the machine to monitor.
If you liked this article, share it and let me know what you think about it on Twitter.
Thanks for sharing.
I am trying to understand the need for the extra spaces when editing alarm.conf
sudo vim / etc/netdata/health_alarm_notify.conf